Kendo Charts use modern browser technologies to render high-quality data visualizations in the browser. Rather than generating images on a server, Chart graphics are rendered in the browser using SVG, with a fallback to VML for older browsers.
-
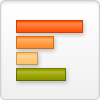
Bar Charts
Shows value changes over time or compares values
-
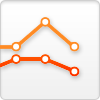
Line Chart
Shows trends in data over regular intervals
-
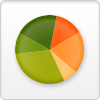
Pie Chart
Shows size of items with respect to the total
-
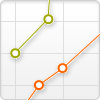
Scatter Charts
Shows two dimensional points or lines