The following documentation is available:
HTML5 introduces a new HTML element - the CANVAS tag. This tag allows for two dimensional drawing easily using Javascript. This makes it perfect for producing graphs. Because Javascript runs on your users computer, none of the stress on your server normally associated with producing graphs (as is currently the norm) is incurred. Not only that but because of the greater processing power that is typically available on users' computers, they will be much faster. And, because the code can be both compressed (for example if you're using Apache, mod_gzip will do this automatically for you) and cached, bandwidth usage can be massively reduced. This makes it economically attractive to employ, (ie it can save you money...).
Imagine, you are creating 100,000 graphs a day and the data is such that the resulting graphs cannot be cached. With the RGraph library you can reduce that figure to zero. All the processing and graph creation is done by each individual client, much like rendering the HTML you send to them. So you don't have to send any images, you simply send them the Javascript libraries once. So, much lower bandwidth bills and far less strain on your webserver.
And if that wasn't enough, because the graphs are created using Javascript, they will work offline if you view a .html page on your own PC. Download the archive and see! Useful if you need to do a presentation for example and want to use the same graph(s) as your website.
Since the graphs are produced using HTML5 features (the new canvas tag), client support is currently:
The HTML5 canvas tag is part of the HTML5 specification, and all of the above browsers have some sort of support for it.
Canvas & Microsoft Internet Explorer (MSIE)
Microsoft Internet Explorer 8 doesn't natively support the HTML5 <canvas> tag. To support
MSIE 8 you will need to use either
Google Chrome Frame or
ExCanvas from Google
(which is included in the RGraph archive). Read more about Internet Explorer compatibility
here.
RGraph and older browsers
Older browsers (eg Chrome 1, Firefox 3, Safari 3, Opera 9.5) are supported, however if they don't support the canvas shadow or
text APIs, these will naturally be unavailable. Earlier versions of these browsers may work, but are untested.
Although performance is excellent, (traditionally your webserver has been producing all of your graphs, and now the client produces them, and typically only one at a time), you may still want to tune RGraph further. The biggest thing you can do is use compression, which reduces the initial download time of the libraries, but there are a number of things you can do:
To achieve this with Apache you have a few options:
You can get pre-minified versions of the libraries here.
You should also consider the effect that this has when your page is rather weighty. If the page is weighty there will be a small delay before the onload event fires, and therefore creates the graph. This might not be so bad if the graph is not immediately visible, however if it is then you should carefully consider using the onload event. You may wish to load the library in the page header, define the canvas tag and then immediately define the javascript that creates the graph. This way the graph will be created and shown, and then the rest of the page loads. The end result is that your graph appears to be faster.
Between the onload event, asychronous Javascript and careful tag placement, you will need to experiment to get the right result for you.
function addListener(func)
{
    if(window.addEventListener) {
        window.addEventListener('DOMContentLoaded', func, false);
    } else {
        document.attachEvent("onDOMContentLoaded", func);
    }
}
You can read more about the DOMContentLoaded event on the Mozilla site, here,
and the Microsoft site here.
There's an example here.
Another effect of combining libraries is reducing the amount of HTTP connections needed to retrieve them. Most browsers have a limit on how many connections they can create simultaneously, so if they're not being used to retrieve your graph libraries, they can be used for something else. Reducing the number of HTTP connections also eliminates the time spent setting up those connections.
Although there's a lot you can do in regards to performance, a few of the points here will suffice for most websites:
Getting RGraph up and running is very easy and consists of three steps. If you're having trouble I suggest you get hold of a copy of Firefox along with Firebug - its Javascript error console will make debugging your issue much easier. Many problems are down to a library not having been included or not using the onload event when you need to. You might also benefit from using the Web Developer toolbar for Firefox. This allows you to easily disable caching, thus eliminating any problems that that causes. You could equally use the Chrome developer tools, which also provide a good quality Javascript console.
<script src="RGraph.common.core.js"></script>

<script src="RGraph.common.adjusting.js"></script> <!-- Just needed for adjusting -->
<script src="RGraph.common.annotate.js"></script>  <!-- Just needed for annotating -->
<script src="RGraph.common.context.js"></script>   <!-- Just needed for context menus -->
<script src="RGraph.common.resizing.js"></script>  <!-- Just needed for resizing -->
<script src="RGraph.common.tooltips.js"></script>  <!-- Just needed for tooltips -->
<script src="RGraph.common.zoom.js"></script>      <!-- Just needed for zoom -->

<script src="RGraph.bar.js"></script>              <!-- Just needed for bar graphs -->
<script src="RGraph.bipolar.js"></script>          <!-- Just needed for bi-polar graphs -->
<script src="RGraph.funnel.js"></script>           <!-- Just needed for funnel charts -->
<script src="RGraph.gantt.js"></script>            <!-- Just needed for gantt charts -->
<script src="RGraph.hbar.js"></script>             <!-- Just needed for horizontal bar charts -->
<script src="RGraph.hprogress.js"></script>        <!-- Just needed for horizontal progress bars -->
<script src="RGraph.led.js"></script>              <!-- Just needed for LED charts -->
<script src="RGraph.line.js"></script>             <!-- Just needed for line graphs -->
<script src="RGraph.meter.js"></script>            <!-- Just needed for meter charts -->
<script src="RGraph.odo.js"></script>              <!-- Just needed for odometers -->
<script src="RGraph.pie.js"></script>              <!-- Just needed for pie charts -->
<script src="RGraph.rose.js"></script>             <!-- Just needed for rose charts -->
<script src="RGraph.rscatter.js"></script>         <!-- Just needed for rscatter charts -->
<script src="RGraph.scatter.js"></script>          <!-- Just needed for scatter graphs -->
<script src="RGraph.tradar.js"></script>           <!-- Just needed for traditional radar charts -->
<script src="RGraph.vprogress.js"></script>        <!-- Just needed for vertical progress bars -->
<canvas id="myCanvas" width="600" height="250">[No canvas support]</canvas>
<script>
    window.onload = function ()
    {
        var data = [280, 45, 133, 166, 84, 259, 266, 960, 219, 311, 67, 89];

        var bar = new RGraph.Bar('myCanvas', data);
        bar.Set('chart.labels', ['Jan', 'Feb', 'Mar', 'Apr', 'May', 'Jun', 'Jul', 'Aug', 'Sep', 'Oct', 'Nov', 'Dec']);
        bar.Set('chart.gutter', 35);
        bar.Draw();
    }
</script>
There's also a very basic example of using RGraph, that does very little. It can be helpful to illustrate how you can get RGraph up and running.
The common library has now been split into separate files. This was because the single common library had become far too large. If you don't use any of the dynamic features, then you still need to change your code, as RGraph.common.js is now called RGraph.common.core.js.
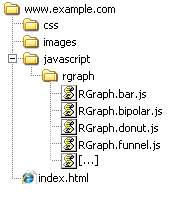
The suggested layout structure for the RGraph libraries is shown on the right. The www.example.com folder represents the root/top level of your website with the javascript directory beneath that. The css and images folders are shown for illustrative purposes only. If you follow this layout then your URLs to the RGraph libraries would be:
/javascript/rgraph/RGraph.common.core.js
/javascript/rgraph/RGraph.bar.js
etc
By using this structure you make RGraph easy to update should you need to, and also keep all the RGraph libraries in one, easy to find, place.
This is a very easy process, as easy as sending content to the browser. All you need to do is make the data variable contain the data you want to be displayed. Eg:
<script src="RGraph.common.core.js"></script>
<script src="RGraph.line.js"></script>

<canvas id="myCanvasTag" width="600" height="200">[No canvas support]</canvas>

<script>
    var data = [78,16,26,23,25,51,34,64,84,84];
    var line = new RGraph.Line("myCanvasTag", data);
    line.Set("chart.labels", ["Feb", "Mar", "Apr", "May", "Jun", "Jul", "Aug", "Sep", "Oct", "Nov"]);
    line.Draw();
</script>
To get the above using PHP you could do this:
<?php
    // This simply makes a string out of the array of data
    $myData = join(',', array(78,16,26,23,25,51,34,64,84,84));

    // This prints out the required HTML markup
    print('<script src="RGraph.common.core.js"></script>' . "\n");
    print('<script src="RGraph.line.js"></script>' . "\n\n");
    print('<canvas id="myCanvasTag" width="600" height="200">[No canvas support]</canvas>' . "\n\n");
    print('<script>' . "\n");
    print('    var data = [' . $myData . '];' . "\n");
    print('    var line = new RGraph.Line("myCanvasTag", data);' . "\n");
    print('    line.Set("chart.labels", ["Feb", "Mar", "Apr", "May", "Jun", "Jul", "Aug", "Sep", "Oct", "Nov"]);' . "\n");
    print('    line.Draw();' . "\n");
    print('</script>');
?>
Strictly speaking the var isn't necessary, however if you put the code inside a function (like window.onload), it's probably best to do so as using var will make the variable local, and not global. So doing so will help prevent naming clashes.
This is a simple matter of formatting what you get back from MySQL into a string, as the MySQL dump and PHP code below shows (it's based on a database called RGraph_example):
#
# Table structure for table `daily_statistics`
#

CREATE TABLE `daily_statistics` (
  `st_day` char(9) NOT NULL,
  `st_statistics` tinyint(4) NOT NULL,
  UNIQUE KEY `st_day` (`st_day`)
) ENGINE=MyISAM DEFAULT CHARSET=latin1;

#
# Dumping data for table `daily_statistics`
#

INSERT INTO `daily_statistics` VALUES ('Mon', 124);
INSERT INTO `daily_statistics` VALUES ('Tue', 95);
INSERT INTO `daily_statistics` VALUES ('Wed', 64);
INSERT INTO `daily_statistics` VALUES ('Thu', 94);
INSERT INTO `daily_statistics` VALUES ('Fri', 75);
INSERT INTO `daily_statistics` VALUES ('Sat', 98);
INSERT INTO `daily_statistics` VALUES ('Sun', 84);
<?php
    /**
    * Change these to your own credentials
    */
    $hostname = "localhost";
    $username = "root";
    $password = "PASSWORD";
    $database = "RGraph_example";

    $connection = mysql_connect($hostname, $username, $password) OR die('Could not connect to MySQL: ' . mysql_error());
    mysql_select_db($database);

    $result = mysql_query("SELECT st_day, st_statistics FROM daily_statistics");
    if ($result) {

        $labels = array();
        $data   = array();

        while ($row = mysql_fetch_assoc($result)) {
            $labels[] = $row["st_day"];
            $data[]   = $row["st_statistics"];
        }

        // Now you can aggregate all the data into one string
        $data_string = "[" . implode(", ", $data) . "]";
        $labels_string = "['" . implode("', '", $labels) . "']";
    } else {
        print('MySQL query failed with error: ' . mysql_error());
    }
?>
<html>
<head>

    <!-- Don't forget to update these paths -->

    <script src="libraries/RGraph.common.core.js" ></script>
    <script src="libraries/RGraph.line.js" ></script>

</head>
<body>

    <canvas id="cvs" width="600" height="250">[No canvas support]</canvas>
    <script>
        graph = new RGraph.Line('cvs', <?php print($data_string) ?>);
        graph.Set('chart.background.grid.autofit', true);
        graph.Set('chart.gutter', 17);
        graph.Set('chart.hmargin', 10);
        graph.Set('chart.tickmarks', 'endcircle');
        graph.Set('chart.labels', <?php print($labels_string) ?>);

        graph.context.translate(12, 0);

        graph.Draw();
    </script>

</body>
</html>
This PHP code provides the data in two strings - $labels_string and $data_string.. These variables are then used in the RGraph code to provide the data and the labels.
Remember:
If you want to get data from your server using AJAX, here is a simple function that you could use to get the data:
<script>
    /**
    * Makes an AJAX call. It calls the given callback (a function) when ready
    *
    * @param string   url      The URL to retrieve
    * @param function callback A function object that is called when the response is ready, there's an example below
    *                          called "myCallback".
    */
    function AjaxCall (url, callback)
    {
        // Mozilla, Safari, ...
        if (window.XMLHttpRequest) {
            var httpRequest = new XMLHttpRequest();

        // MSIE
        } else if (window.ActiveXObject) {
            var httpRequest = new ActiveXObject("Microsoft.XMLHTTP");
        }

        httpRequest.onreadystatechange = callback;

        httpRequest.open('GET', url, true);
        httpRequest.send();
    }


    /**
    * This sample callback function is called when the data is ready (readyState=4)
    */
    function myCallback ()
    {
        if (this.readyState == 4 && this.status == 200) {
            // Everything is good, the response is received
            alert(this.responseText);
        }
    }
</script>
And you would use it like this:
<script>
    AjaxCall('http://www.example.com/getSomething.php', myCallback);
</script>
|
|
| Subscribe to RGraph support |
| Visit this group |
Support is available via a Google Groups forum. If you think that the issue you have is common, try the issues page first, and then try searching the forum in case your question has been answered previously. If that all yields nothing, post a question to the forum.
If you want to keep up-to-date on RGraph, then subscribe to the group, as I post update notifications here. You can also follow me on Twitter. I post update notifications here along with HTML5 related news.